Instruction manual for KNApSAcK:
A Comprehensive Species-Metabolite Relationship Database
Yukiko Nakamura, Hiroko Asahi, Md. Altaf-Ul-Amin, Ken Kurokawa and Shigehiko Kanaya.
Introduction
The KNApSAcK package when installed in the user's computer provides tool for analyzing his/her own datasets of mass spectra that are prepared according to a particular format, as well as for retrieving information on metabolites by entering the name of a metabolite, the name of an organism, molecular weight or molecular formula. A list of metabolites that are associated to a taxonomic class can be obtained by search with the taxonomic name, from which information of individual metabolites can be retrieved.
A. Execution of KNApSAcK database
From the viewpoint of using KNApSAcK, two different versions are available. (i) Web-version and (ii) Download-version.
1. Web-version
To use the web-version of KNApSAcK, get into http://kanaya.naist.jp/KNApSAcK/KNApSAcK.php .
2. Download-version
If and when a user wants to customize KNApSAcK to use for some purpose, Java j2sdk-1.4.2 is required to be installed in the user's computer. First, the compressed file, KNApSAcK_database.zip is to be downloaded from http://kanaya.naist.jp/KNApSAcK/. Under KNApSAcK_database folder, there are two folders (spectrum data and taxonomic files), and two files (KNApSAcK.jar and knapsack.gif). User can access KNApSAcK database by clicking KNApSAcK.jar.
B. Search menus
Search menus and search procedures are the same for both the web-version and the download-version.
1. Search Options of the KNApSAcK database
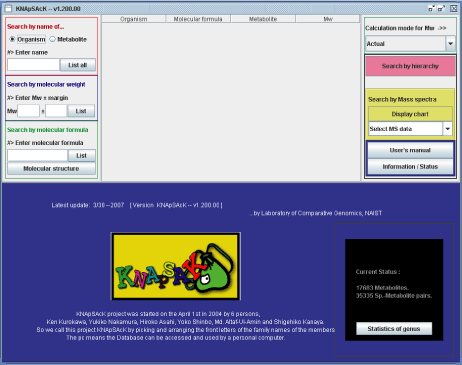
The Main window of KNApSAcK is shown in Panel 1. Information on metabolites contained in the database can be searched by entering the name of metabolite, organism (scientific name), molecular weight or molecular formula. The search result is listed in the middle of the upper half of the panel.
The numbers of metabolites and metabolite-species relations compiled in the present version of the database are displayed in the lower right corner of the panel.
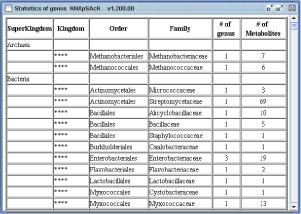
Detail information of the accumulated data in the database, for example the number of metabolites and genus in each family can be retrieved by clicking "Statistics of genus" button (Panel 1b).
 Panel 1a
 Panel 1b
(1) Search by the name of metabolite or organism (Red panel in left side)
Small and capital letters are not distinguished, in case of search by organism (scientific name) or metabolite name.
(1a) Search by the name of an organism (scientific name)
Select Organism (Step 1 in Scheme 1a), enter organism name (Step 2) and click the List button (Step 3). The entered organism name in matched to those in the database. Organism name can be the name of a species on a genus. If we input "Ara" then metabolites associated to species name with "ara" are listed. For example, metabolites associated to Arabidopsis thaliana, Marah macrocarpus and so on are listed.
 Scheme 1a
(1b) Search by the name of a metabolite
Select Metabolite (Step 1 in Scheme 1b), enter metabolite name (Step 2) and click the List button (Step 3). The entered metabolite name is matched perfectly to those in the database. If we input "glucose" then metabolites with "glucose" are listed. For example, ADP-D-glucose, D-glucose 6-phosphate and so on.
 Scheme 1b
(2) Search by molecular weight (blue panel in left side)
If we enter desired molecular weight (say 150) and a margin value (say 1) (Step 1 in Scheme 2), and click the List button (Step 2), the metabolites whose molecular weight are within the range 149-151 are listed.
 Scheme 2
(3) Search by molecular formula
Metabolite names and origins of the metabolites are listed by molecular formula search. Enter molecular formula (Step 1 in Scheme 3a) and click the List button (Step 2).
 Scheme 3a
When users are interested to know molecular structures corresponding to a molecular formula, molecular structure button should be clicked after entering the molecular formula and the molecular structure in displayed in a separate panel.
 Scheme 3b
(4) Search by hierarchy
Click "Search by hierarchy" button (pink) in the right side of the panel (Step 1 in Scheme 4) and then hierarchy table appears in the bottom of the panel. Next, select any taxonomic name in any hierarchical level and click the Search button (Step 2), then genus names belonging to the selected taxonomy are listed on the right side. Next select a genus name (Step 3), then Organism names, Molecular formulae, Metabolite names and Molecular weights are listed in the upper panel.
As an example, when Brassicaceae under the taxonomic level of family is selected, the corresponding upper taxonomical levels are automatically assigned in the panel (Panel 2), that is, order, subclass, phylum, kingdom and superkingdom are automatically changed to "Brassicales", "rosides", "Streptophyta", "Viridiplantae" and "Eukaryota" respectively.
 Scheme 4
 Panel 2
(5) Search of compounds in mass spectra
Format of mass spectra data set
The format of mass spectra data set is the same for the Web- and the Download-version (See Format of mass spectra data). The data set must be constructed as a text file. The first line, comment line for mass spectra data, must be started by ":". The second line, attribute of individual mass spectra data, must also be started by ":". Each column is separated by a tab. The first column corresponds to m/z, and the second to last columns correspond to experimental conditions defined by user. Each line from the third to the last contains values of m/z and corresponding intensities in the individual experimental conditions. In the following example, Comment line is ":Arabidopsis T87 14days-Negative mode Scaling". In the second line, ":Mean_Mass" is described by default, "Light", "Dark" and "Light_2" correspond to experimental conditions defined by user. The following lines contain m/z and corresponding intensities in Light, Dark and Light_2 conditions.
 Format of mass spectra data
(5a) Web-version
Paste mass spectra data set to box for MASS data (Step 1 in Scheme 5a), click submit botton (Step 2) and select "Your data" in Display chart (Step 3), then chart of mass spectra (Panel 3) is obtained.
 Scheme 5a
(5b) Download-version
KNApSAcK_database folder contains two folders (spectrum data and taxonomic files), and two files ( KNApSAcK.jar and ReadMe(KNApSAcK).txt). Save a file of mass specta data with required format as described above to spectrumdata folder, then Click KNApSAcK.jar. Select the file you want to analyze in Display chart (corresponding to Step 3 in Scheme 5a), then chart of mass spectra (Panel 3) is obtained.
 Panel 3
Up to three spectra can be displayed and analyzed simultaneously by the proposed system. The spectra selected are overlaid with different colors and shown in the middle panel. Any spectrum can be brought to the front by spectrum selection (A in Panel 3). Any region of the spectra can be enlarged by stretching the cursor horizontally and shown in the lower panel (B). All masses in the files are displayed on the left side of the panel (C). When a mass is selected from the list, a black vertical line pointer moves to the position of the peak of the mass on the spectra, and simultaneously possible metabolites corresponding to that molecular mass or masses close to that are shown in the upper panel. The margin value is changeable (D). As it is helpful to show the mass value with the value of an additive ion such as H+ and K+ depending on the solvent used for sample preparation, the species of additive ions are selectable (E).
When a user set [Actual - H]- in calculation mode for Mw and select a m/z value, 95.02147002, the database system regards the molecular weight without ionization as 96.0292951019 = 95.02147002 + monoisotopic molecular weight for hydrogen ion (1.0078250319) and retrieve metabolites corresponding to this molecular weight.
C. KNApSAcK
KNApSAcK project was started on the April 1st in 2004 by 6 persons, Ken Kurokawa, Yukiko Nakamura, Hiroko Asahi, Yoko Shinbo, Md. Altaf-Ul-Amin and Shigehiko Kanaya. So we call this project KNApSAcK by picking and arranging the front letters of the family names of the members. The pc means the Database can be accessed and used by a personal computer.
Copyright (C) 2007 NAIST Comparative Genomics Laboratory All Rights Reserved.


